


Why the Stock Market Rally is Gaslighting Investors into Thinking Everything's OK
It isn't.
 - Wikipedia")
The big story of last week was Trump's softer stance on China and Fed Governor Powell. Although the market was fully-aware that a 125% import duty on Chinese goods was unsustainable (mutually-assured destruction), equities were still pleased to hear it directly from the horse's mouth. Furthermore, as for Powell keeping his job; we should all breathe a sigh of relief safe in the knowledge that the Commander in Chief’s influence on monetary policy will remain limited to pissing, moaning, and insulting the world’s top central banker on social media.
The market response was, shall we say, optimistic. The S&P gained almost 5% on the week, buoyed by Alphabet’s (GOOG) Q1 earnings beat (saved by a one-time $8illion unrealized gain from its investment in Anthropic AI).
What the Chart Says
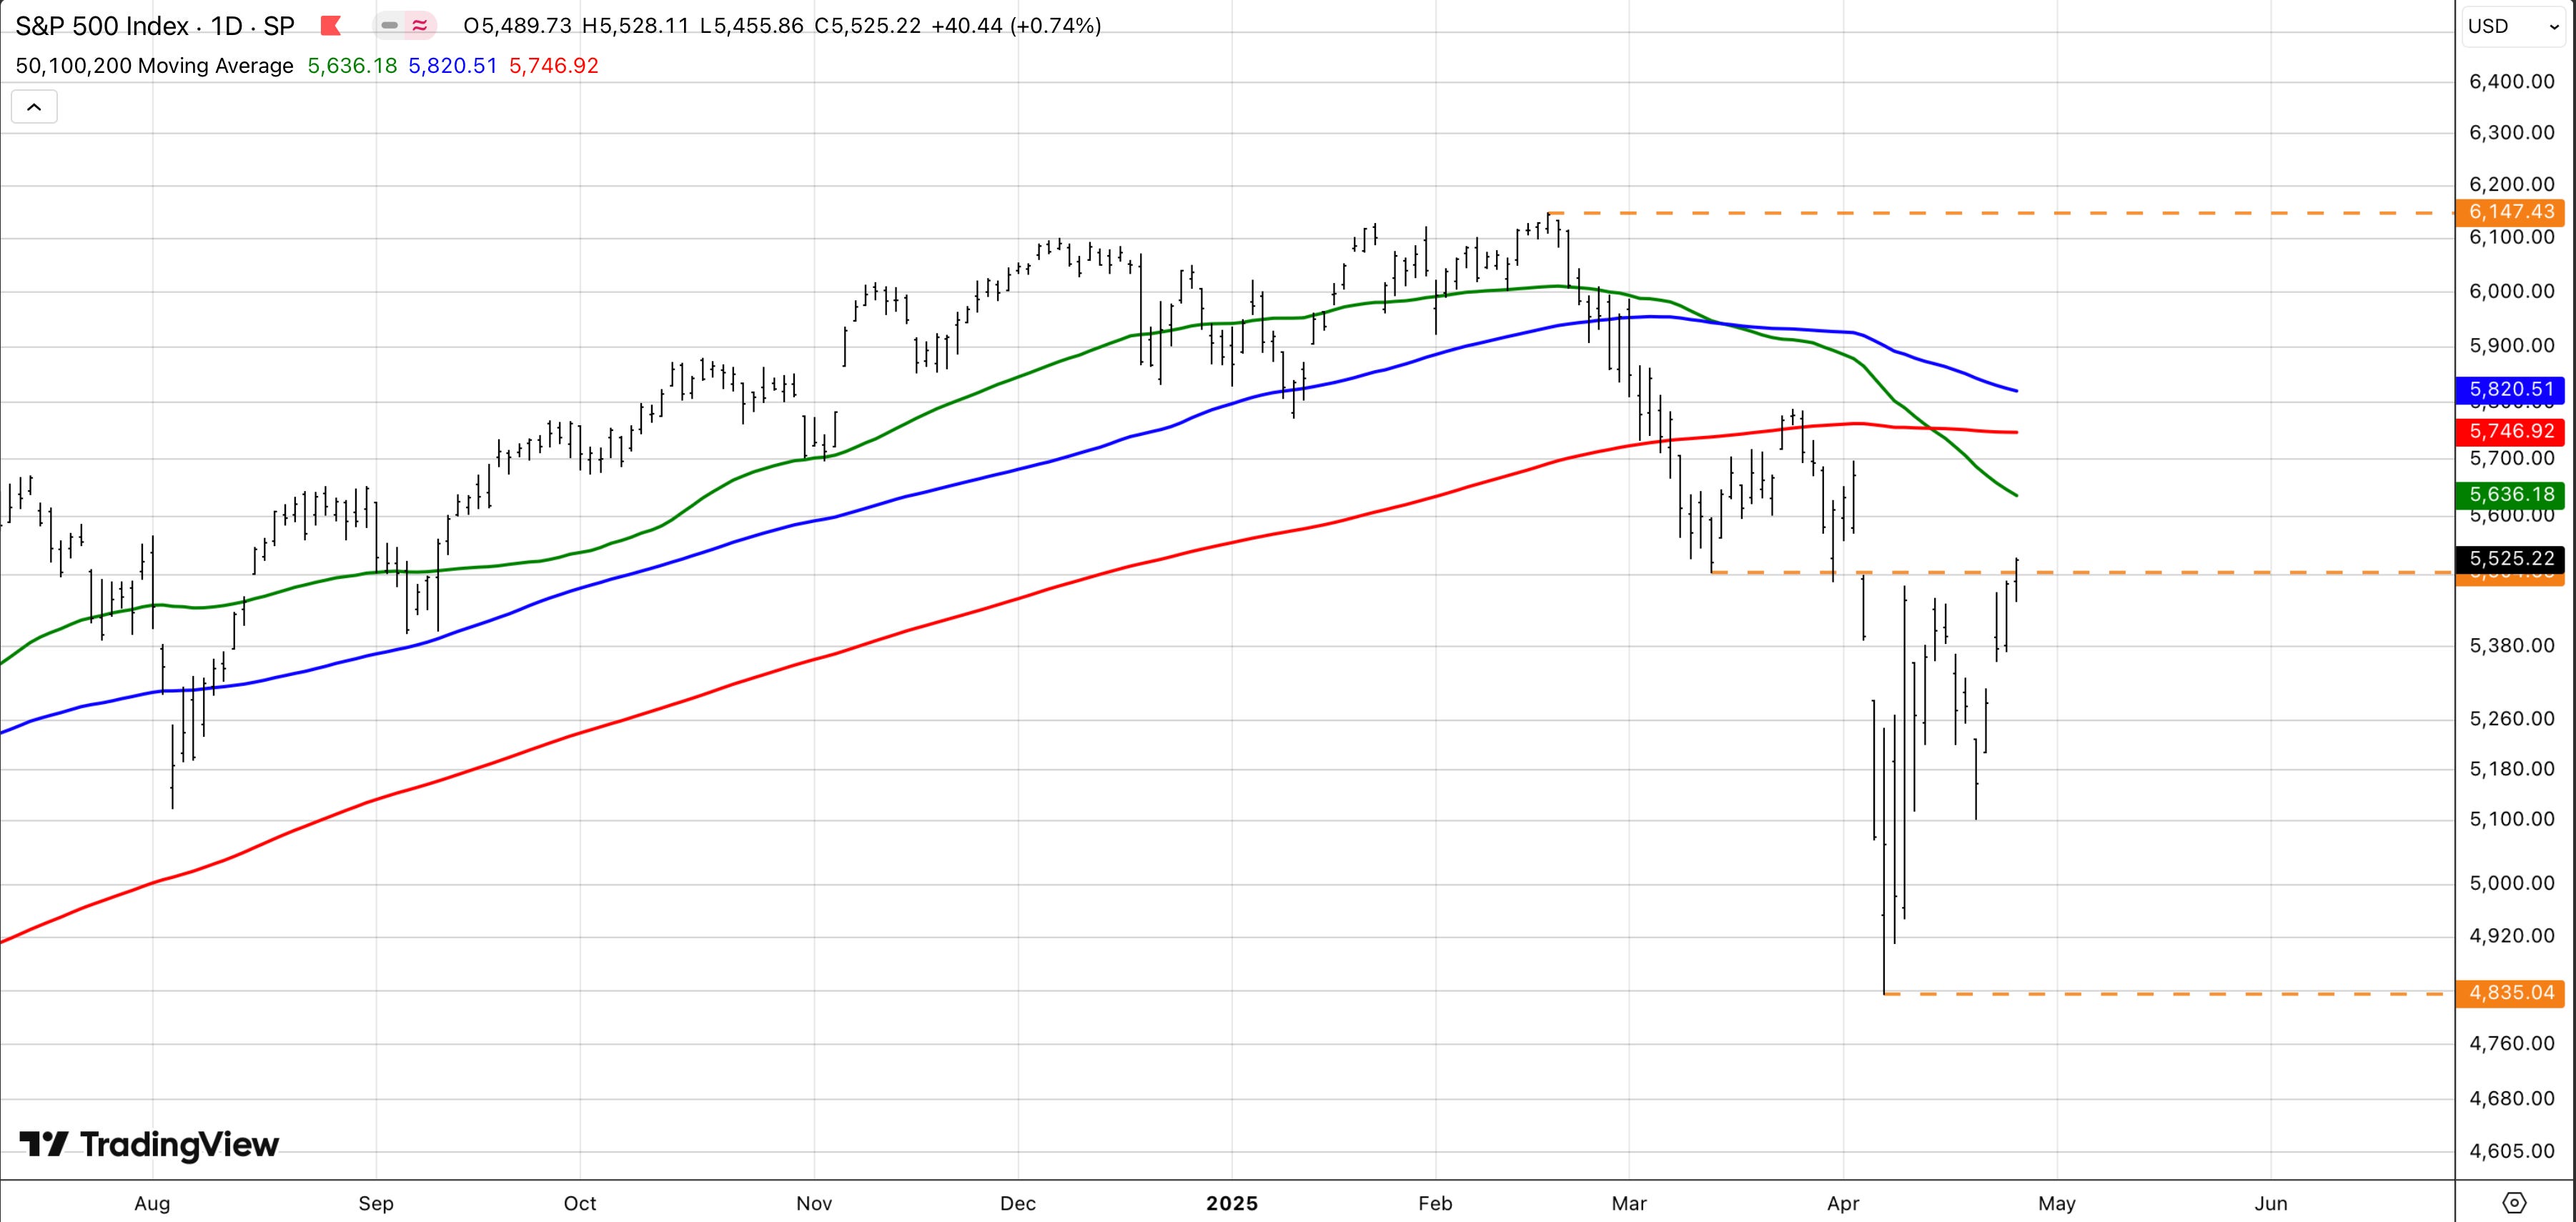
Technically speaking (we’ll dig into the macro later on), the S&P is in much better shape than it was a week ago. On Friday, the index registered its highest closing price since liberation day; which logically makes no sense unless we believe the outlook for US stocks has somehow improved in the last three weeks (it hasn’t). But then again, in the short-term all that really matters is positioning, flows and liquidity.
looking at the daily chart, the first thing you’ll notice is just how much progress the market has made from the lows. Friday’s close was a dizzying 13.6% higher than the post-Liberation day lows of around 4,800, and yet still almost 11% below February’s all-time high.
Constructively, the S&P has now closed above the near-term resistance at 5,500 (March 13 low, and April 9 high). As such, the next technical target is the 50-DMA at 5,636, followed by the 200-DMA at 5,746. Is 5,700+ my base-case for the S&P? No, but of course it’s possible. However, unless it’s justified by ‘proper’ progress with China (not Trump pretending he’s spoken with Xi) I expect it to be meet with more deleveraging (selling) from the professional community..
Is the Volatility Over?
The Vix index (a measure of implied volatility for the SP500) pulled back substantially last week (chart 1), finishing Friday a shade under 25. Some will argue that the Vix’s decline is ‘proof’ that market participants are less concerned about the future — But it’s merely a function of the puts bought weeks ago at higher implied volatility decaying as the S&P rises and time passes. Nonetheless, a lower (and/or stable) Vix increases liquidity (chart 2), which in turn encourages buying, which in turn forces the Vix lower, which in turn…you get it. This is the reflexive nature of markets; higher prices lead to higher prices.
What’s important to remember is that this dynamic goes both ways. Although the flywheel propelled markets higher last week, we shouldn’t expect implied volatility to stay as low as it is now. If this is, as I suspect, a gamma-fueled (we’ll get to that soon), dead-cat bounce, we should soon see equities turn lower and the vix higher, at which point, lower prices will lead to lower prices.
Vix (top Pane)

S&P500 E-Mini Liquidity

Are Systematic Funds (Robots) Buying Stocks?
In a word, yes.
The Vix moving lower would have already encouraged buying from Volatility-controlled funds (they buy stocks when Vix down and vice versa). However, Thursday’s price action, lifted the S&P above the first ‘buy trigger’ for the trend-following CTA community. How much they will buy is debatable, but somewhere between $5b - $10b over the next week is a fair estimate (more if we clear the next trigger at 5,595).

CTA equity positioning ($billions) and projected flows into Global equities (left pane) and S&P500 (right pane)

Market-Maker Hedging Flows
Turning to the GEX (Gamma Exposure Graph), we see that market-makers are still operating in a negative-Gamma regime. As such, the market will still be vulnerable to wild swings and amplified trading ranges in both directions. That said, we are a hairs breadth away from that changing…
Keep reading with a 7-day free trial
Subscribe to Trading Floor Whispers to keep reading this post and get 7 days of free access to the full post archives.