The Tactical Trader: Todays Top Charts

Trading Floor Whispers is brought to you by Felix and the team at GoatAcademy.org.
If you like real market news delivered to your inbox daily, enjoy and share this email with your friends ❤️
To get access to our trade ideas, in depth weekly market research and predictions, join the premium community.
Today's tactical trader is taking a different twist. In this issue, we'll be diving into the technical outlook for the top trending indices and stocks.
Hope you enjoy!
SPDR S&P ETF (SPY)
Trend 📈: Weak Bull
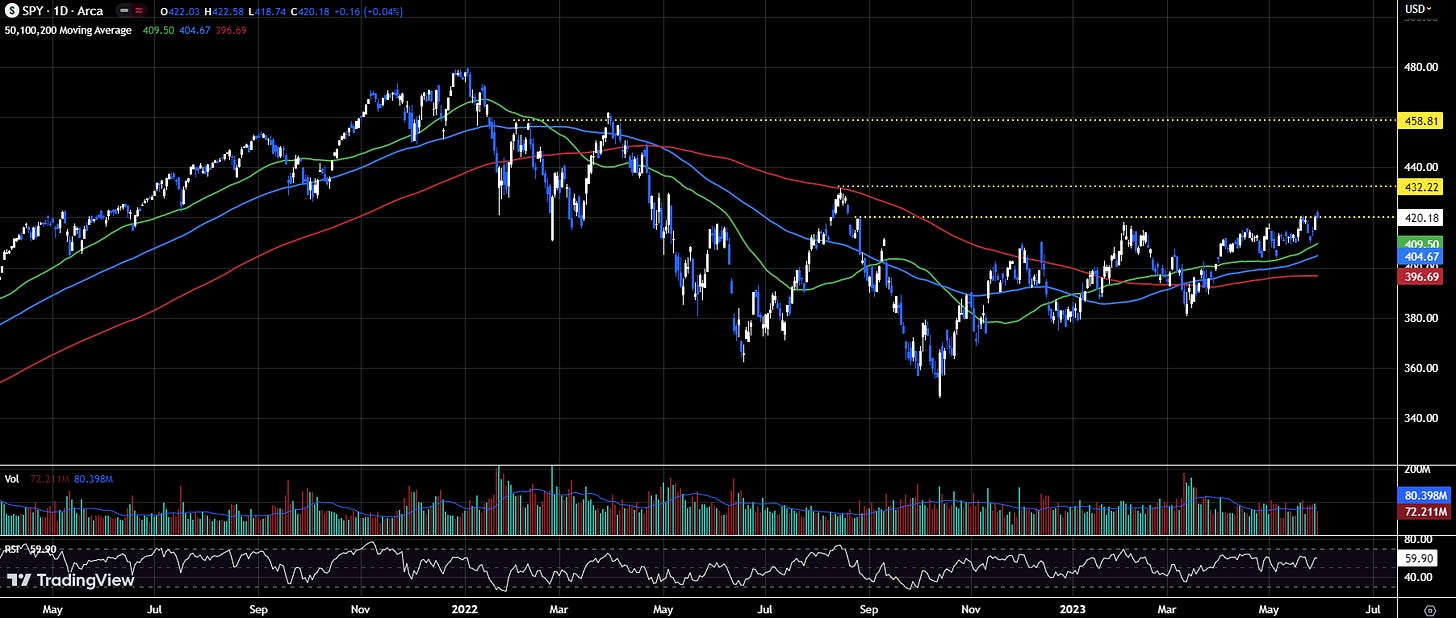
The SPY briefly popped its head above the $420 resistance early in yesterday's session, tagging a 9-month high of $423.58. However the early debt-ceiling bid faded later in the day, with the index settling bang on the significant $420 barrier.
Is this the blow-off top I've been waiting for? It's hard to say right now, but yesterday's reversal could be telling. If the weakness bleeds into today's session, I'd certainly be more confident in calling a near-term top. On the flip-side, a strong close to the week, sets us up for more strength.
Bull Case 🐂
A weekly close above $420 would establish a new trading range, with $420 acting as support and $432 as a potential upside target.
Bear Case 🐻
A close below 420 today raises the odds that yesterday's pop was the final squeeze of this short-covering rally. The longer we remain below $420, the more it reinforces it as a resistance level. In that event, I expect the may lows around $405, aligned with 100-day moving average, to be tested.
Invesco QQQ Nasdaq ETF
Trend 📈: Raging (but stretched) Bull
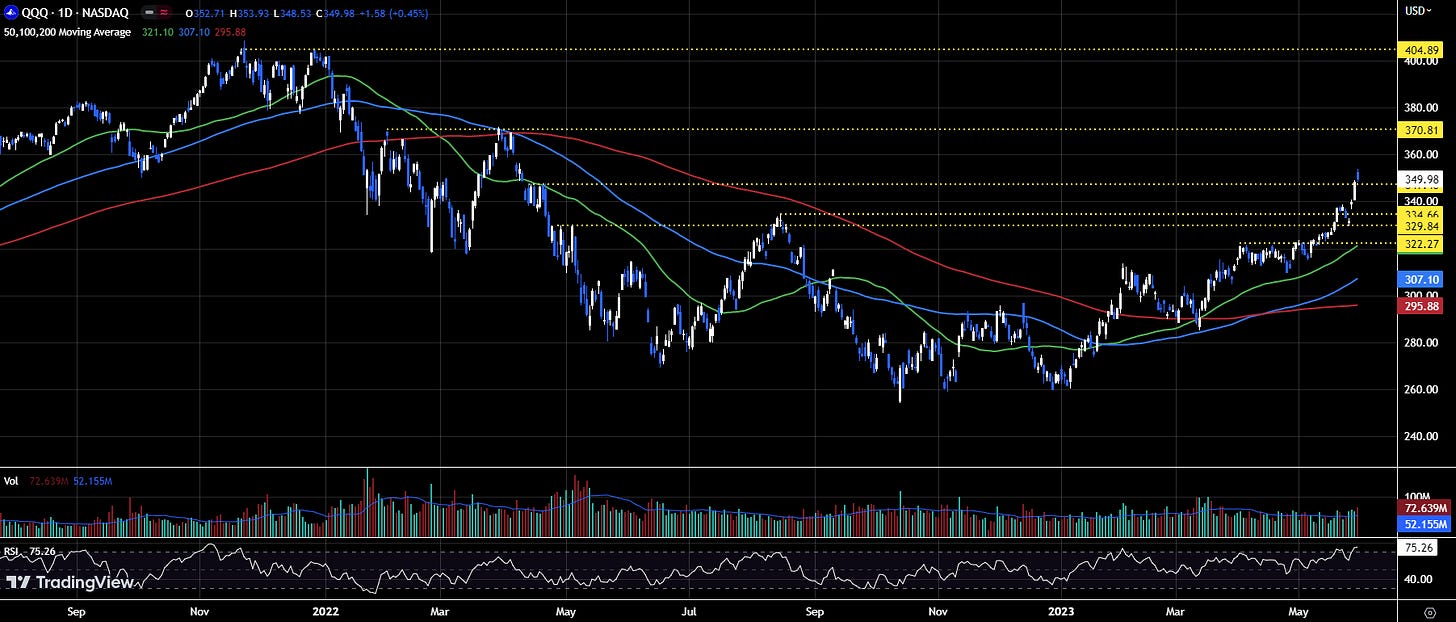
The Nasdaq ETF printed a new one year high of $353.93 in early trading yesterday, before closing towards the session lows at $349.98
Similar to the SPY, I'm wondering if this is the first sign of exhaustion in this vertical rally reminiscent of the price action in March. Notably the RSI shows the price is the most-overbought since the November 2021 all-time-high.
It's far too early to say if the rally has run it's course, but a material correction is long overdue. That's no to say I'd sell the QQQ's outright, but cheap long puts or put spreads offer a low-risk way to play the pull back.
Bull Case 🐂
A period of consolidation above the August highs of $335 is needed to work off some of the "overbought" signals. Should we see that, an argument can be made for an extension towards the April highs around $370. With that in mind, if you want to play from the long-side, adding on weakness approaching the $335 support is preferable to buying here.
Bear Case 🐻
Of course, the momentum is unsustainable, but it's far to dangerous to fight against it. I'd be a seller below $335, looking for an extension down to $322, where the April highs align with the 50-day moving average. A deeper correction brings the December 2022 highs and the 200-day moving average at $295 into view.
Apple (AAPL)
Trend 📈: Raging (but stretched) Bull
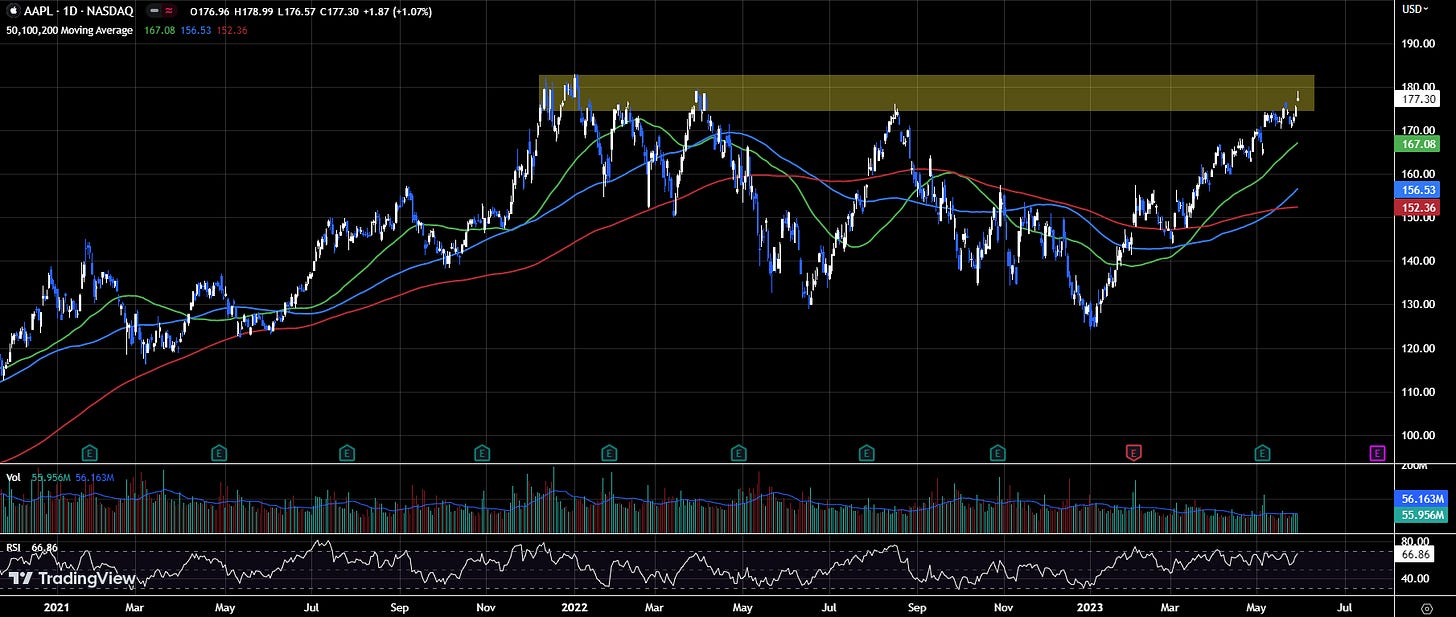
Apple squeezed to a 9-month high $178.99, ending the session marginally higher at $177.30.
The stocks is clearly at a crucial price point. Since topping out at $188.28 in January 2022, this is the fourth attempt at printing a new ATH. The last three failed tries preceded huge sell-offs. Will it be fourth time the charm? Who knows, but that gravestone Doji candle from yesterday screams exhaustion.
Bull Case 🐂
The momentum is encouraging and the price isn't quite as stretched some other tech names. But an RSI of 67 warrants caution, especially considering how the stock has performed at this level in the past. If you're thinking of buying Apple, I'd look to enter on a pullback towards $155-160 should it get there.
Bear Case 🐻
Aside from a relatively high RSI I don't see a compelling short setup at the current price level. That being said, a close below the May lows of $170 could force profit-taking from late-to-the game longs. In that event, the bulls might get their shot in the $155-160 area
Amazon (AMZN)
Trend 📈: Growing Bull
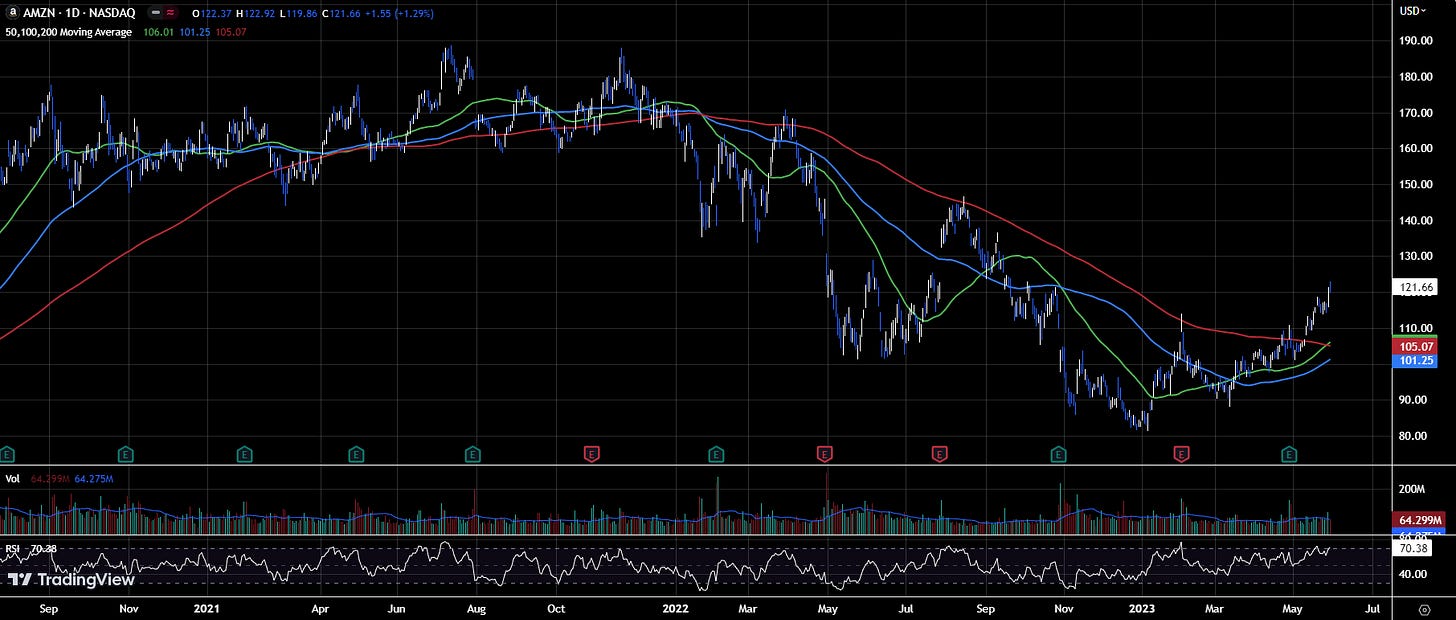
Another stock, another 9-month high. It's almost like these things are correlated. A decent performance from Amazon of late, which added another 1.3% yesterday. The Relative Strength Index of 70.4 has wandered into overbought territory (>70), which is worth keeping an eye on.
Bull Case 🐂
The 50-day moving average has just crossed above the 200-day (golden cross), which highlights the growing bullish momentum. Although technical analysts consider that a strong buying signal, it's not something I consider relevant.
The trend is encouraging and appears to be catching steam. But the stretched RSI suggests the price may need to consolidate before moving higher. With that in mind, a dip into the $105 area (50/200 day moving averages), would provide a better entry point for those wanting to establish longs.
Bear Case 🐻
No immediate short setup at the current price. But that changes should the price slide below the 200-day moving average at $105. In that event, I see potential for an extension into the March lows around $90.
Tesla (TSLA)
Trend 📈: Growing Bull
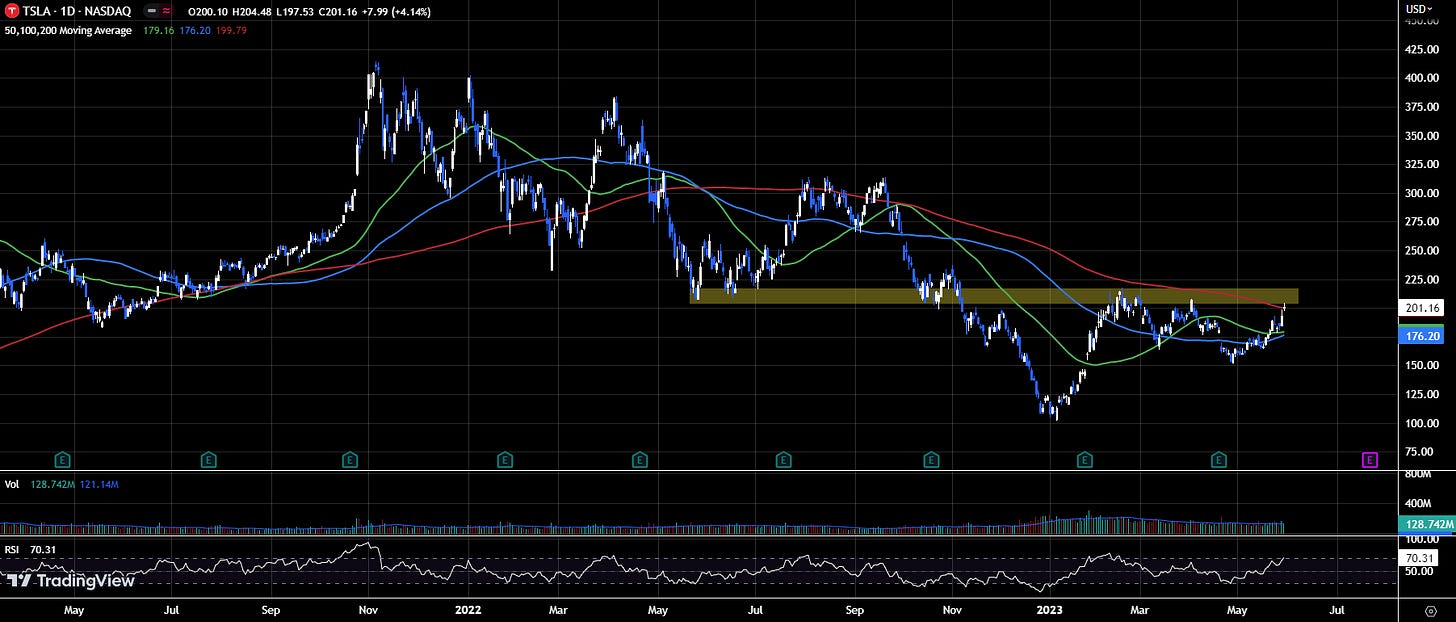
A decent effort from Tesla yesterday, with the stock gaining 4.14%, closing at $201.16, just above the 200-day moving average at $199.79.
The question now is whether it can maintain this momentum? Although clearing the 200-day is a start, previous trips above $200 this year have been short-lived. The real test is if the price can clear out the February highs around $220 — with an RSI of 70.3, we may have to wait a while to find out.
Bull Case 🐂
A close above $220 would suggest the overhead selling at that level has been absorbed, clearing the path for an upside expansion. Targets are tricky with Tesla, but a squeeze into the $250-$275 wouldn't surprise me on a broader market rally.
Bear Case 🐻
I'm definitely not going to fight against this fan favourite after a close above the 200-day. But should it fail to hold above it like in October, we might see a pullback to the 100-day at $176.20. And a close below that would be very bearish in my opinion, targeting $150 initially, with the possibility of a washout towards the January lows of $102.
Meta Platforms (META)
Trend 📈: Raging (but stretched) Bull
Meta stocks ended the day slightly higher at $262.52, the highest close since January 2022.
What can I say, the Facebook is in beast mode. The stock is up 25% in the last 5 weeks, 120% since the start of the year, and more than 200% from the October lows. Taking that into consideration, it's hardly surprising that the RSI of 79.55 is almost breaking out to the pane above it.
Bull Case 🐂
The major moving averages are all trending higher, and the stock certainly has the wind at it's back. However, it's approaching a key band of resistance in the $290-$300 range, which should put the brakes on this move. Definitely not a buyer of the stock at anywhere close to this price range.
Bear Case 🐻
The RSI is through the roof, so we should expect a reasonable retracement at some stage. However, picking the top of parabolic moves is a suicide mission. I don't see an attractive short play at the current level. Although, that changes, on a break of the May lows at $230, and the 50-day at $225.
Below $225, we could see an extension towards the 100-day average at $195. Below that, the 200-day at $163 is a possibility.
Alphabet Inc (GOOG)
Trend 📈: Tired Bull
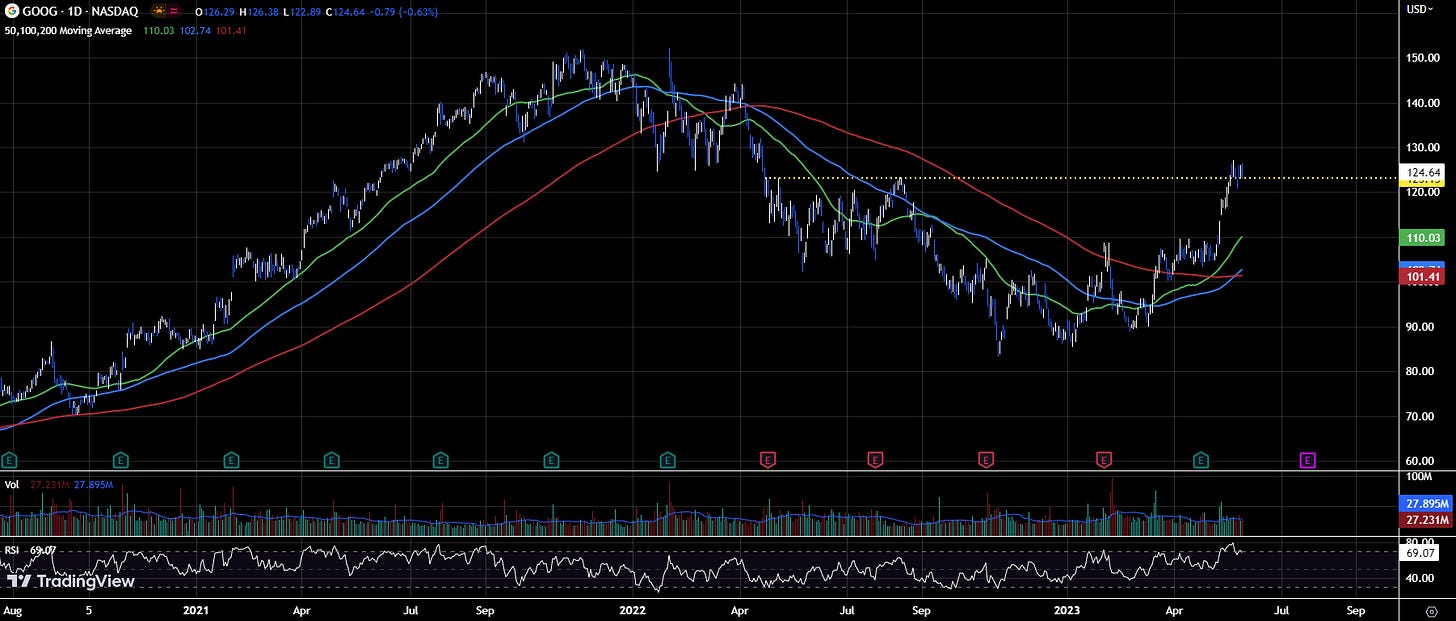
After clearing the August highs mid-May, Google hasn't found the energy for more gains. As such, the stock's spent two-weeks consolidating in a tight $122-$127 trading range — Something's gotta give.
Bull Case 🐂
Decisive clearance of $127 would be constructive, targeting the $140-$145 range. Although, it's more likely the below bear case plays out.
Bear Case 🐻
I'm looking for a break of the recent lows around $122, to open a short position. Initial target is $110, where the late-March and early-April highs meet the 50-Day moving average. Below that, I'd expect to see the 200-day at $101.20 come into focus pretty quickly.
Nvidia (NVDA)
Trend 📈: Coked-up Bull on Steroids
Bull Case 🐂
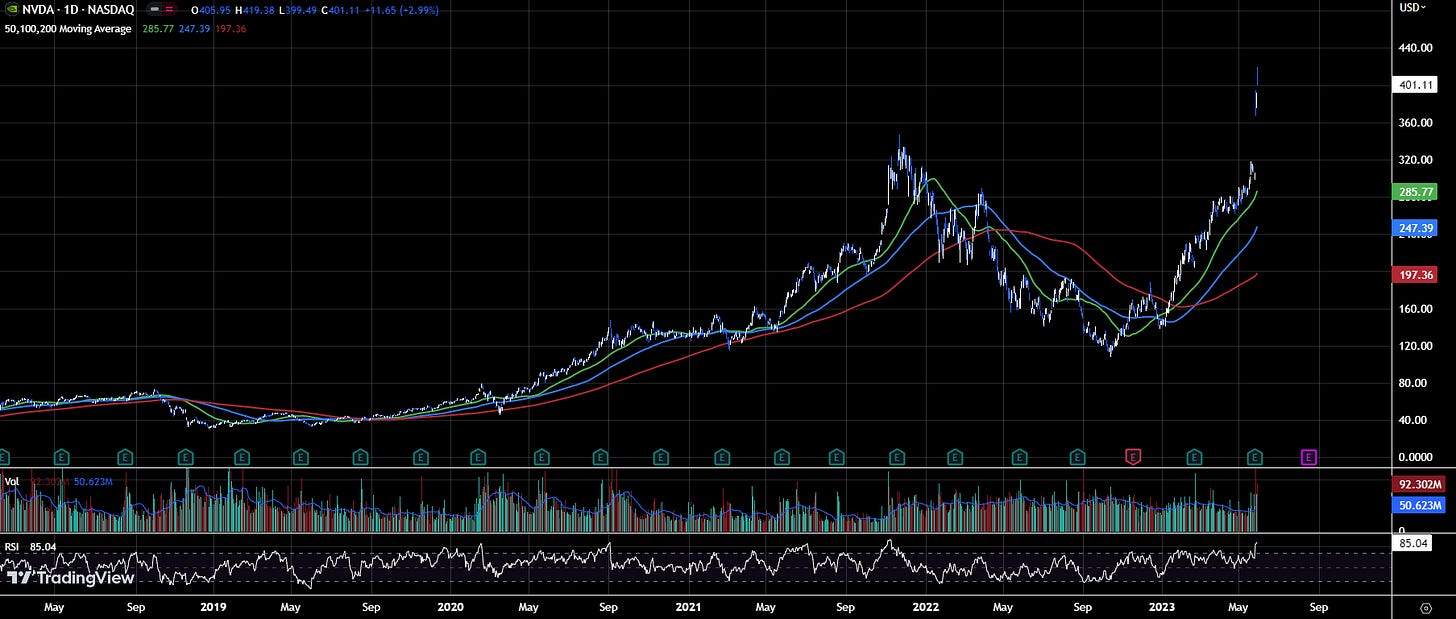
A.I is taking over the world and in the near future we'll be governed by a ruling-class of Nvidia powered super-intelligent robot overlords.
Would I be surprised if the stock was trading at $500 sometime soon?....No.
Will I buy it? Also no.
Bear Case 🐻
Most overbought since the November 2021 former all-time high. Maybe the most-crowded trade on the street right now, with hardly any short interest. Would I be surprised if NVDA crashes sometime soon?...No.
Will I sell it...No.
It's untradeable!
Summary
Although, all the charts we've looked at are trending higher, many of them are extremely stretched on the upside. For that reason, buyers should exercise caution. Furthermore, longs need to be mindful that when markets are at extremes, they often have extreme moves in the opposite direction.
As always, thanks for reading and good luck out there.
Elliott.
Disclaimer
The content in this website is for informational and educational purposes only. It does not constitute and should not be construed as financial or investment advice or an offer to purchase or sell securities. The content is not personalized or tailored to a specific person or group of persons, nor to their personal investment or financial needs. You should consult a financial adviser or other investment professional authorized to provide investment advice. Investing comes with risks, including the risk of loss. Presentations of trades made by Vinal or its personnel are not a guarantee that any investment decision made by a student will be successful. Past performance is not a guarantee of future performance.


