The S&P’s 9-Day Win Streak — Best Since 2004
Despite zero (tangible) progress made on trade deals in the last 2 weeks, Friday’s close on the S&P marked the longest streak of green days in almost 3 decades, reaching a high of just aver 5,700, around 900 points higher than the April 7 lows!
Unsurprisingly, the question my coaching students have asked the over the last few days is whether the S&P closing higher 9 days means we’re setting up for another run at 6,000+ in the weeks ahead? Clearly, they didn’t read last week’s post:
Is 5,700+ my base-case for the S&P? No, but of course it’s possible. However, unless it’s justified by ‘proper’ progress with China (not Trump pretending he’s spoken with Xi) I expect it to be meet with more deleveraging (selling) from the professional community..
Which is exactly what happened…
To be fair, 9 up days in a row is pretty rare. You have to go back to 2004 to find the last time the S&P went this long without a down day. Even then, when the market finally broke the streak on day 10, the index dropped a measly 0.10%, then continued higher for another fortnight.
So what’s different this time?
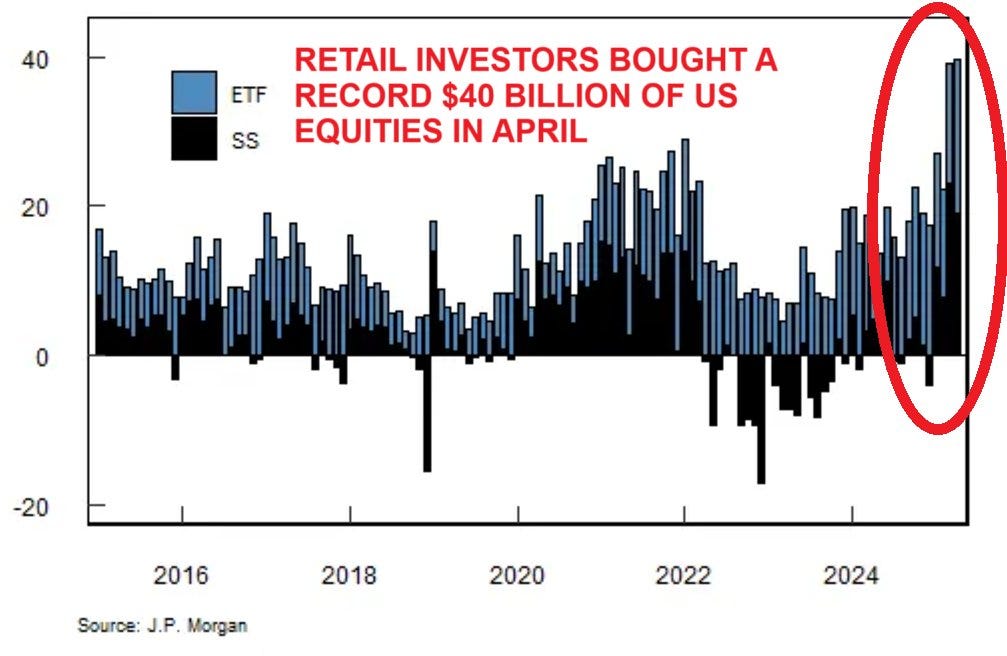
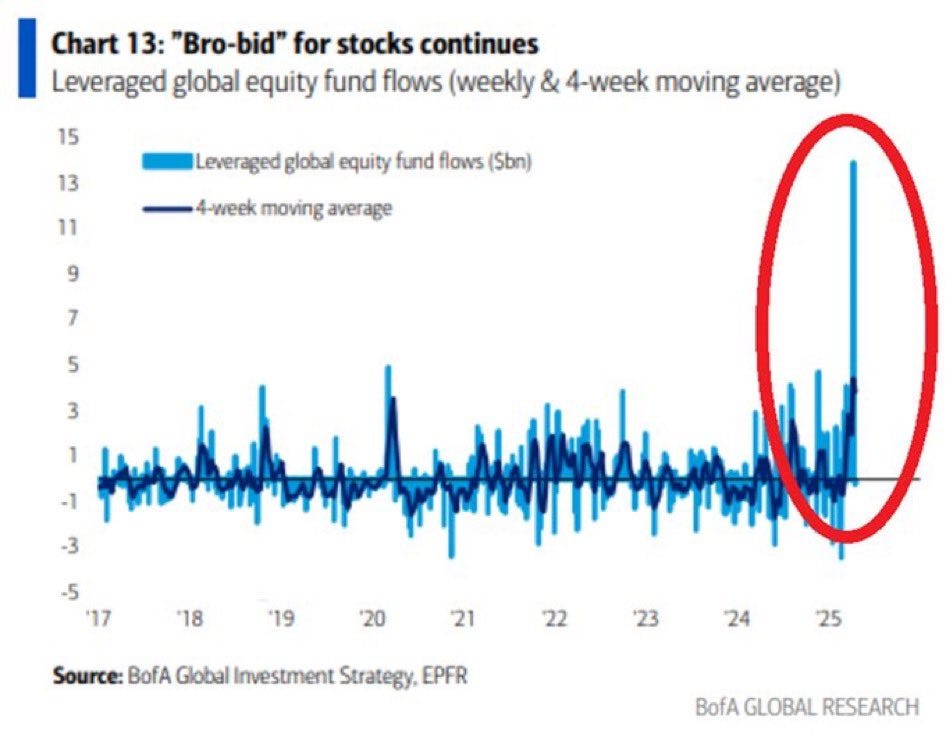
Aside from the obviously unique situation we find ourselves in presently, the previous 28 times the S&P had 9+ consecutive closes were all before 1997. This is significant because the market structure is unrecognizable from 28 years ago (feel old yet?). One of the main reasons the market behaves differently nowadays is that the explosion in options trading and momentum-chasing retail traders (notably since 2020) is amplifying market moves in both directions.
Hoards of fast-twitch, motivated traders chasing momentum (often with options) are definitely making the market more erratic and prone to short-term moves that are driven more by one-sided flows and liquidity (or lack thereof), than economic fundamentals. This dynamic is often fatal for less experienced traders, who fall prey to FOMO without fully understanding the underlying market conditions.
The S&P goes up fastest in bear markets
No, you didn’t misread that— the most ferocious rallies really do often occur during structural bear markets. In fact, the average bear market rally lasts 44 days, with returns over 14% (it’s easy to see why bulls get trapped).
I’ve included the S&P charts from 2000-2002 and 2007-2009 not because I’m expecting similar absolute negative returns now (although, never say never), but to illustrate how the path lower is rarely a straight line. Undoubtedly, the worst thing about bear market rallies, is they are indistinguishable from ‘real’ rallies until it’s too late.
Pros Vs Bros — Who’s right?
Granted, the V-shaped recoveries we are witnessing now may not be a bear market rally at all, it might be a rally rally (like the Aug24 Yen-carry collapse and rebound). If that proves true, the retail crowd who unleashed the largest dip-buying spree on record last month will reap the rewards; while the institutions who refuse to buy into this strength, won’t.
So who’s right?
Keep reading with a 7-day free trial
Subscribe to Trading Floor Whispers to keep reading this post and get 7 days of free access to the full post archives.


